
REPORT
We decentralize marketing
in e-commerce, through a
transparent and collaborative
model, based exclusively on
Cost per Sale
Table of Contents
Issuer Information
| Report type | Operational Report Q1 2026 |
| For the financial year | 01.01.2026 – 31.03.2026 |
| Publication date | 09.04.2026 |
| Name | 2Performant Network S.A. |
| Tax ID | RO26405652 |
| Trade Registry Number | J40/493/2010 |
| Registered office | Corneliu Coposu Blvd. No. 6-8, Unirii View Building, 2nd Floor, (office) ResCo-working09, Sector 3, Bucharest, Romania |
| Subscribed and paid-up share capital | 1,412,484.00 lei |
| Securities trading market | SMT AeRO Premium |
| Total number of shares | 14,124,840 |
| Symbol | 2P |
Investor Contact
Investors@2performant.com • +40 (374) 996 354

Dear investors,
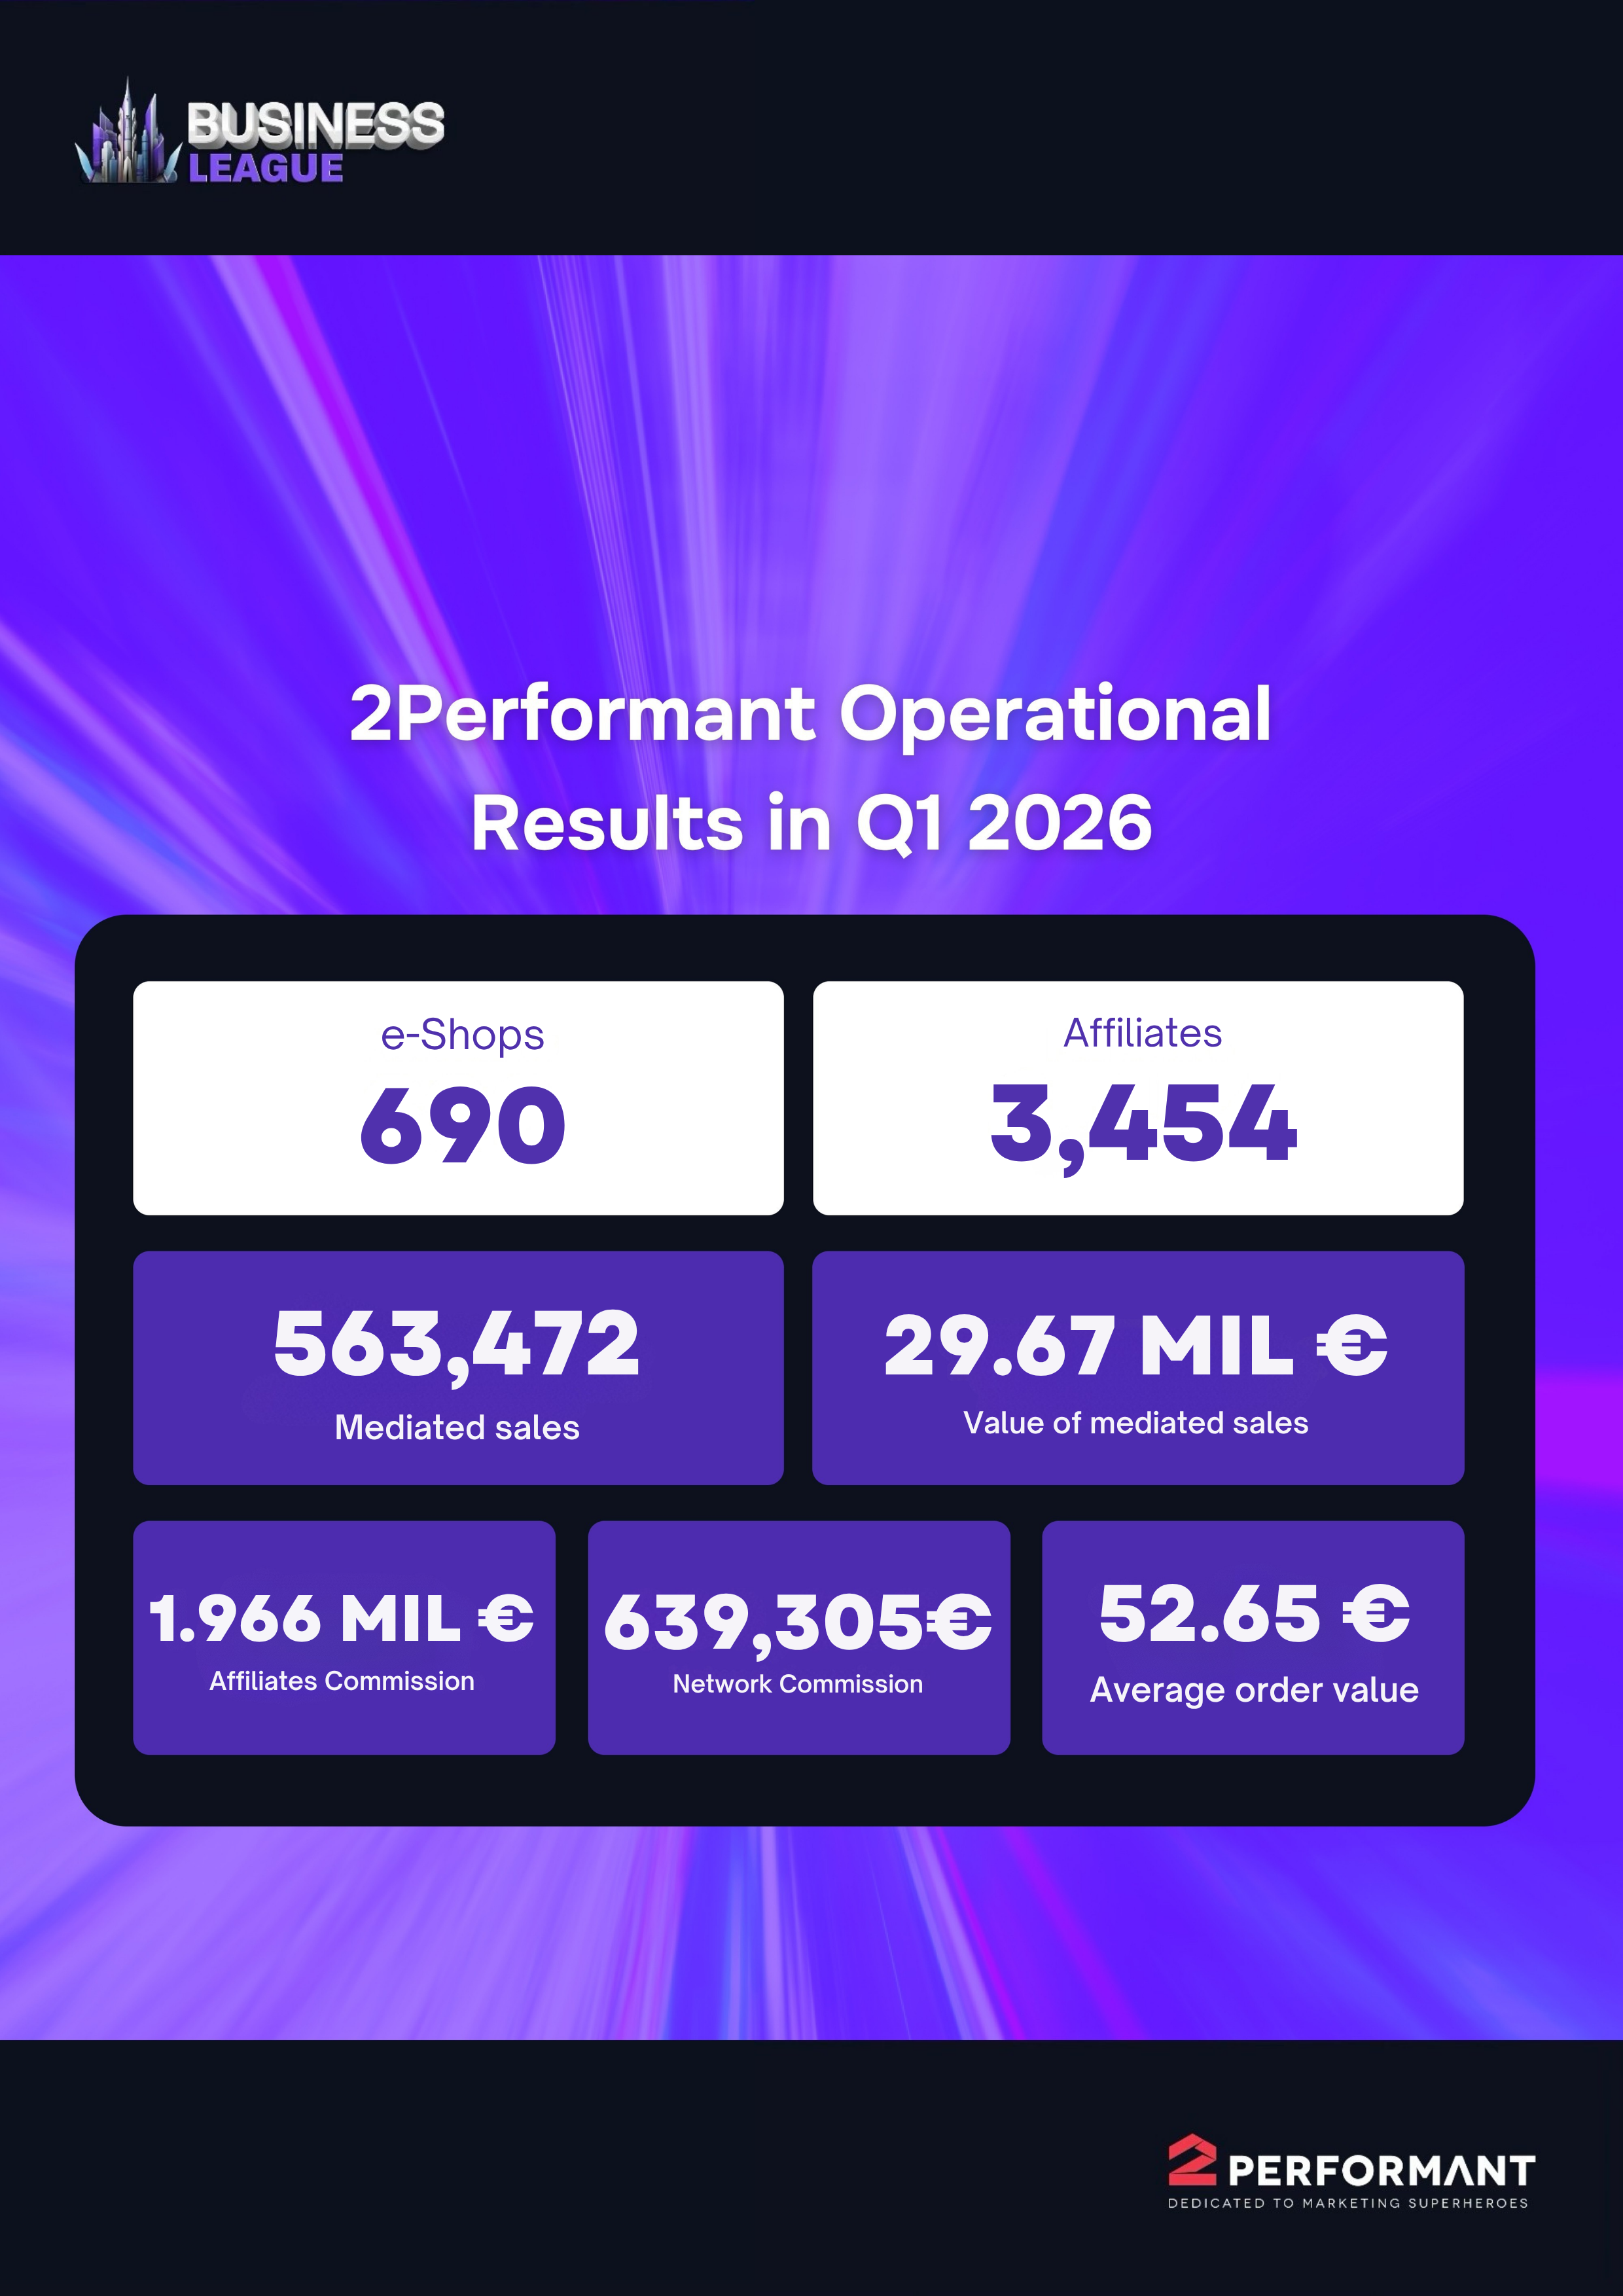
Q1 confirmed the growth trend that began in September 2025. March 2026 marks the 7th consecutive month of growth in the number of sales generated through BusinessLeague — accelerating from 10% in January to 13% in March, in stark contrast to local market trends.
In the first 3 months of the year, our ecosystem generated over 563,000 online sales, worth €30,000,000 plus VAT, across 24 e-commerce categories.
The Platform
In March, ROAS (Return On Ad Spend) in BusinessLeague was 11.14x, exclusively from non-brand traffic. The comparable global industry average is 2.87x. No affiliate network publicly reports similar performance.
These results confirm the soundness of the decisions and investments made over the past 2 years, during which we made significant changes to the platform and business model to scale sustainably, without degrading ecosystem metrics.
The Global Opportunity
We did not build BusinessLeague for the local market. We have been the undisputed leader in Romania for years — but the opportunity we have consistently pursued is capturing a fraction of the global e-commerce performance marketing market, estimated at over $222 billion. For proper scale perspective: Romania ~€50M, Ireland ~€222M, UK ~£8B, US ~$55B.
This is not a market that is easy or cheap to enter. We compete against massive players with billions in resources. All of them, however, rely on an outdated approach — this is one of the few industries yet to be disrupted by the gig economy. Our approach delivers significantly superior results and an acceleration that no other player currently demonstrates.
The following charts show the evolution of 4 key indicators from 2024 to the present. The seasonality specific to our business is visible, as well as the impact of major market and economic events over the past 2 years, and the speed at which we adapted and returned to growth in 2025.
2024 — 2026
Ireland
In February we made the most important move yet toward the global market: we entered the Irish market — overlooked by all major affiliate marketing players, yet strategically crucial:
5 million people, 25k+ online stores, €7B GMV, no local affiliate network, legislation and taxation that made it the preferred EU base for global tech companies. A market culturally and economically connected to the UK and US markets, with a diaspora of over 70 million Irish worldwide — 32 million in the US alone.
We already have 10 active stores in BusinessLeague Ireland, several dozen more in the onboarding pipeline, and the first sales generated. On April 28 we are Gold Partners at ecomm.live, Ireland's largest e-commerce event.
What's Next
In February, the capital increase did not reach the proposed target. We understand investor hesitancy — low liquidity and the financial results of the past 2 years can be concerning when taken out of context. The Q1 2026 figures and the initial results from Ireland confirm that the direction is correct. We continue to build financing pathways for expansion and will communicate them publicly soon.
The plan remains the same.
In 2 weeks we will publish the notice convening the General Shareholders' Meeting of 2Performant Network SA and the proposed budget for this year.
I invite you to read the detailed breakdown of the BusinessLeague ecosystem results in the first 3 months of the year.
Thank you to the 2P team and board for their perseverance and effort.
Thank you for your trust.

Dear investors,
Q1 2026 was the quarter in which we tested whether what we built over the past 5 years can scale. The results say yes.
The BusinessLeague ecosystem generated over 563,000 sales in Q1 2026, up 12% compared to the same period last year, while the network commission grew by 10% YoY. The 7th consecutive month of growth, accelerating in a local e-commerce market that is stagnating or declining.
We launched 112 new stores in the first three months of the year. This is the strongest onboarding quarter in the company's history.
The portfolio has diversified significantly: over 20 categories, from Electronics and Fashion to Books, Pharma, Insurance, and niche categories that did not exist on the platform a year ago. BusinessLeague has become a horizontal ecosystem covering e-commerce as a whole.
The most important product objective in Q1 was increasing the number of active relationships between stores and affiliates. We advanced on multiple fronts: a recommendation system that automatically connects stores with relevant affiliates, activation mechanisms for new accounts, and marketplace improvements to facilitate partner discovery.
We began integrating artificial intelligence into the company's internal processes as a practical efficiency tool. We tested and validated an AI assistance system that provides the team with contextual access to company data, strategic objectives, and operational best practices. The goal is to reduce the time between question and answer, free the team from manual research, and redirect them toward decision-making and action. In parallel, we explored the use of AI in the lead generation process, automating outreach segments. The results are encouraging.
We entered the Irish market in February 2026 with a dedicated setup: a Country Manager with local experience and an internal Taskforce comprising members from the Sales, Support, and Marketing teams. In Q1 we built the foundation: the first stores onboarded, technical and sales infrastructure adapted to the local market. On April 28 we will be Gold Partners at eComm Live, Ireland's largest e-commerce event, our first physical presence in the market.
We will continue to grow the portfolio of active stores, both through acquisition and activation, with a focus on increasing the number of productive relationships between stores and affiliates, which is the most important sales driver in the ecosystem.
In Ireland, we are moving from setup to traction. After a quarter dedicated to testing and building, we have the initial conclusions that will allow us to accelerate on awareness in Q2: the first major event, the first local partnerships, and the first campaigns dedicated to the Irish market.
Sincerely,
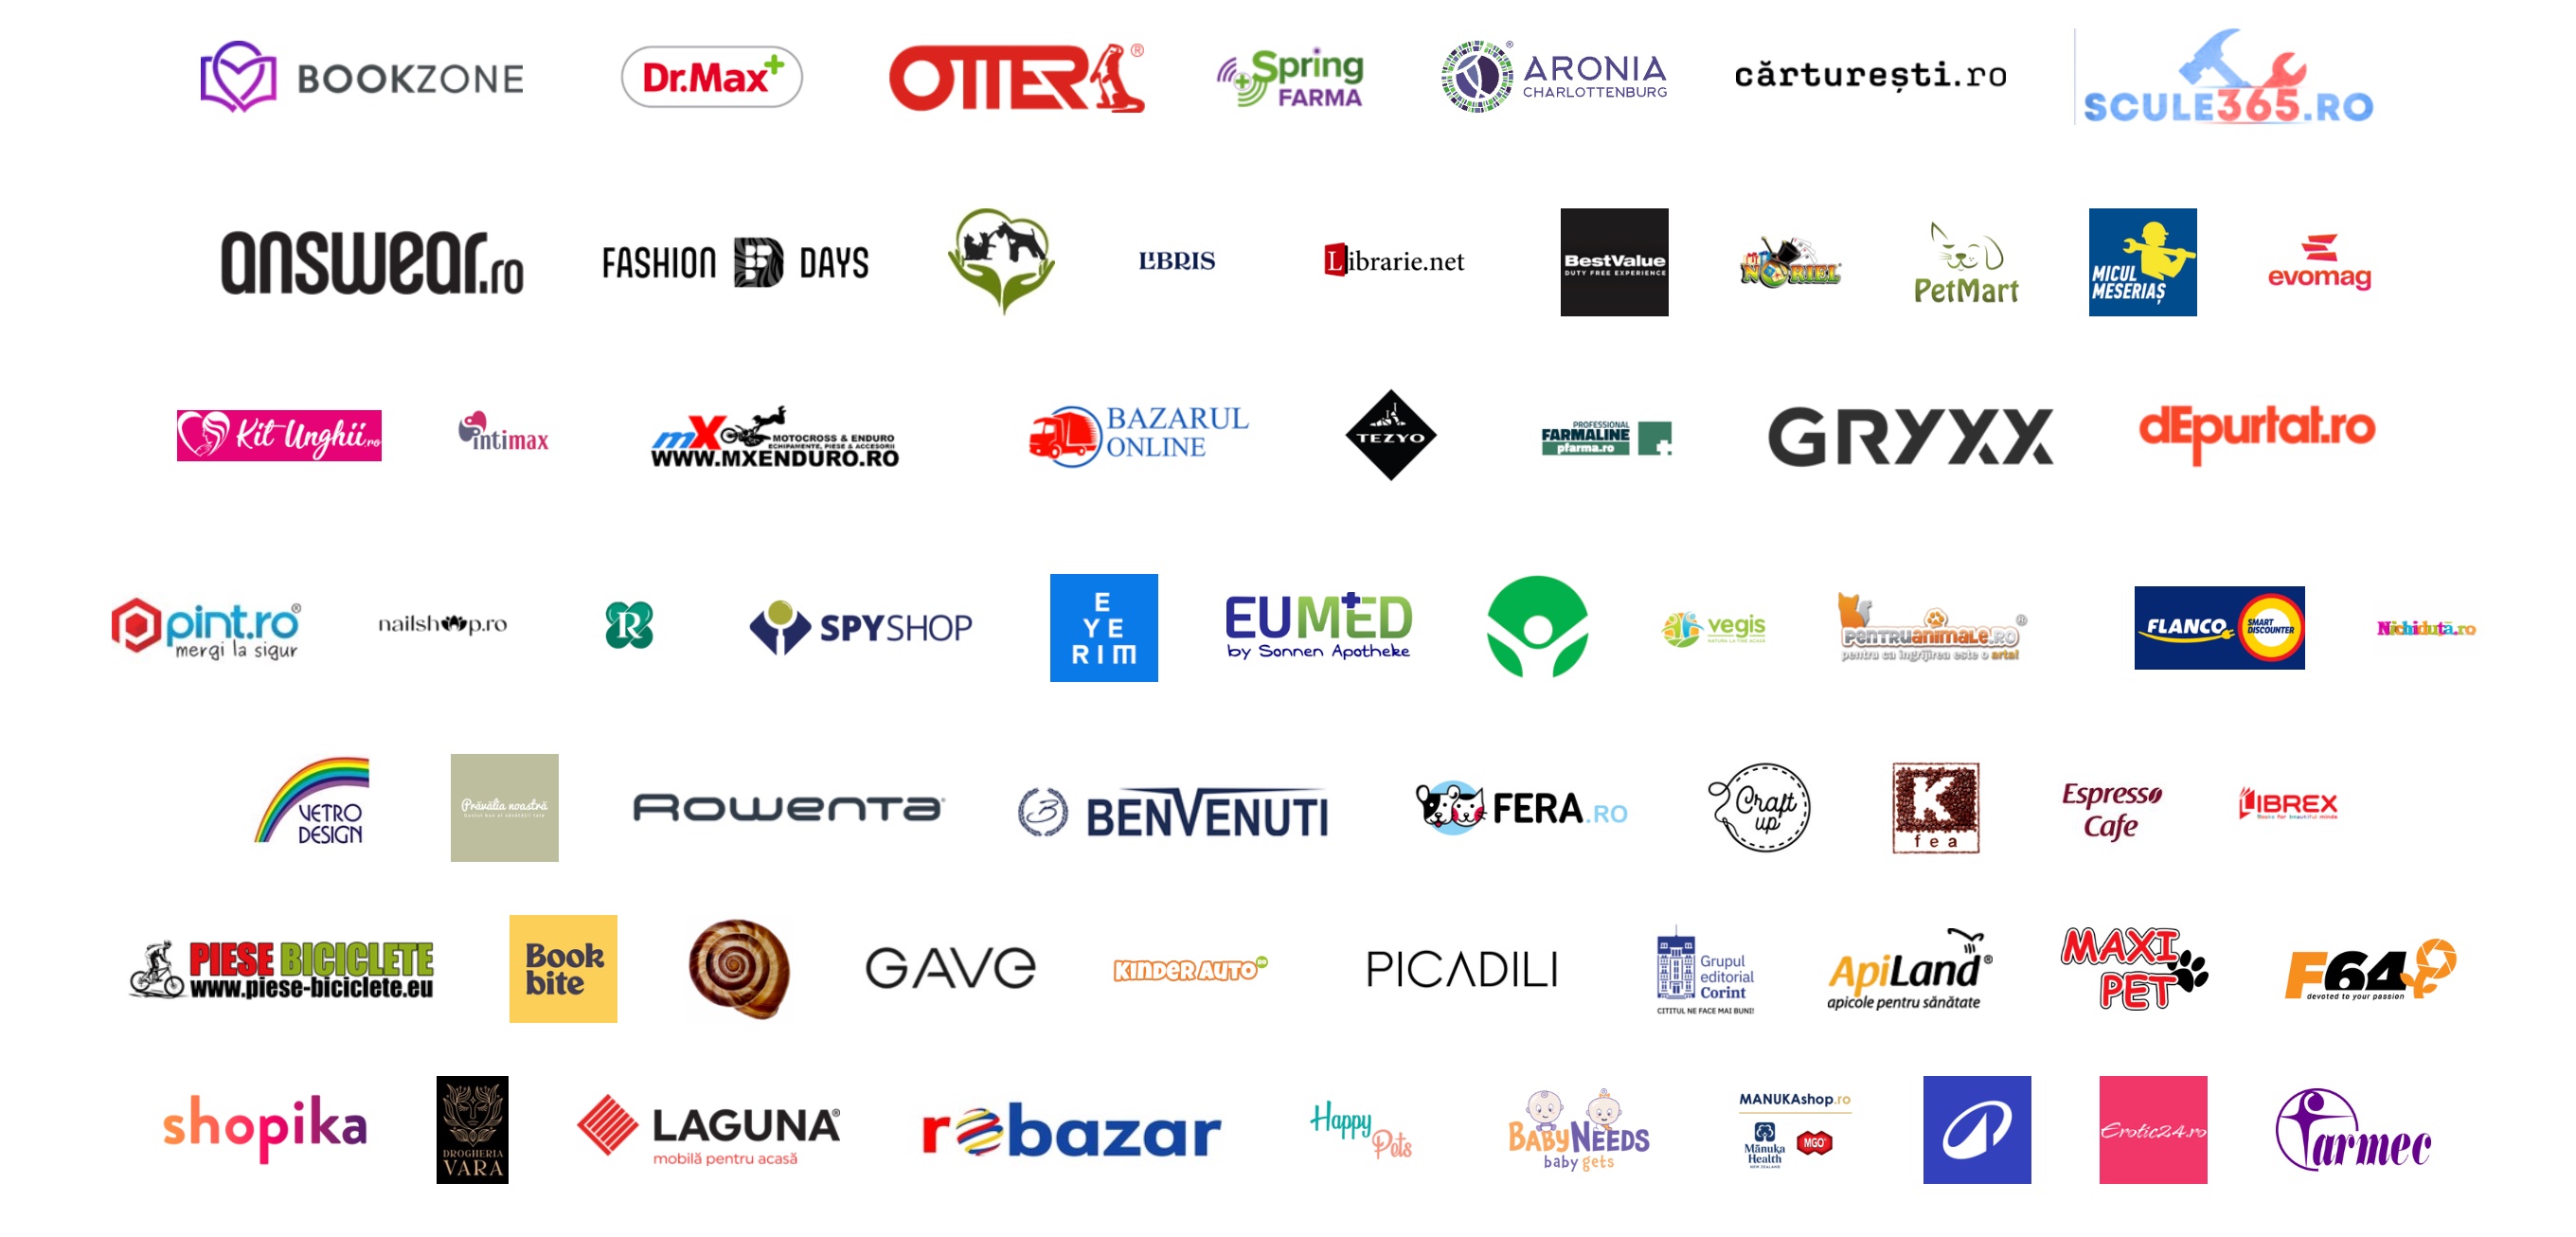
Top 20 E-Shops
Top 20 Affiliates
Top 5 Categories
In Q1 2026, the upward trend that began in September 2025 is confirmed, marking the 7th consecutive month of growth in sales volume generated through the platform, with an accelerating pace from 10% in January to 13% in March.
In total, over 563,000 sales were generated, in contrast with local market trends, which, according to studies published in 2026, show an estimated growth of approximately 5% YoY (compared to 6% in 2025). This context positions the BusinessLeague.com platform in a significantly superior performance zone.
Top 5 Categories — Sales Volume
| # | Category | Sales |
|---|---|---|
| 1 | Books | 139,940 |
| 2 | Pharma | 94,391 |
| 3 | Fashion | 71,833 |
| 4 | Health & Personal Care | 42,139 |
| 5 | Beauty | 38,952 |
| Others | 176,217 |
Top 5 Categories — Sales Value
| # | Category | Value |
|---|---|---|
| 1 | Fashion | 4,258,205 € |
| 2 | Books | 3,306,310 € |
| 3 | Pharma | 2,995,780 € |
| 4 | Beauty | 1,851,330 € |
| 5 | Health & Personal Care | 1,574,957 € |
| Others | 15,683,016 € |
The category ranking remains relatively stable, with one major change in the hierarchy: Health & Personal Care surpassing Electronics IT&C (historically present in the top 5). This shift is primarily driven by the accelerated growth of certain category players, such as aronia-charlottenburg.ro and vetro.ro, which managed to scale rapidly through affiliation, capitalizing on consistent interest in health products, supplements, and personal care. In contrast, the Electronics IT&C category is experiencing a market-level slowdown, due to more tempered demand following peak periods in previous years and a context where many players report stagnation or even declines across their main marketing and sales channels. High-value products and longer replacement cycles reduce purchase frequency, limiting short-term growth potential, especially in the absence of major commercial events. Thus, while Health & Personal Care benefits from volume and recurrence, Electronics IT&C remains dependent on seasonality and promotional campaigns to generate significant growth.
Overall, the positive evolution of the top 5 categories is supported by ecosystem expansion and collaboration efficiency. The total value of sales reaches €30 million. In terms of volume, the Books category maintains its leading position, followed by Fashion, while in terms of value, the hierarchy is reversed.
Analyzing the evolution of the main categories and, granularly, the drivers for each category reveals significant differences between categories in terms of YoY evolution, outlining an ecosystem where growth is primarily driven by the performance of key players, rather than by a uniform market expansion.
Books
The Books category remains stable overall, with visible variations between merchants who continue to embrace program growth, traffic source diversification, and promotion through CSS and Google Search Ads, indicating a concentration of demand toward brands with solid positioning and efficient affiliate execution. This polarization suggests category maturation, where differences in strategy and product offering become increasingly relevant.
| # | Product | Number of Sales |
|---|---|---|
| 1 | Ce știe doar vântul | 1,889 |
| 2 | O generație uimitoare | 1,275 |
| 3 | Gambitul Damei | 1,249 |
| 4 | Alchemised | 1,211 |
| 5 | Pachet Seria completă Menajera – ediție de film | 1,109 |
| 6 | Plante tămăduitoare | 1,054 |
| 7 | Pilde pentru suflet | 1,023 |
| 8 | Confesiunea unui preot | 1,000 |
| 9 | Infern în paradis | 961 |
| 10 | Revoluția alimentară și sănătatea inimii | 897 |
Pharma
In Pharma, the evolution is more balanced, typical of a mature and recurring category. There is accelerated growth for some challenger players, moderate growth for category leaders, and negative variations for other e-shops. This mix of results indicates a stable market where demand is constant, but competition between players leads to occasional volume redistribution without major structural changes.
| # | Product | Number of Sales |
|---|---|---|
| 1 | Șervețele umede pentru copii Pure, 56 bucăți, Huggies | 9,077 |
| 2 | Săpun Lavanda Spring | 7,436 |
| 3 | INTRAFIX® Primeline Classic | 4,342 |
| 4 | Paracetamol 500mg, 20 comprimate, Zentiva | 2,420 |
| 5 | Unguent pentru iritațiile de scutec cu 5% Panthenol Bepanthen, 30g, Bayer | 1,960 |
| 6 | MK Spring Minimarțieni, 2 jeleuri | 1,959 |
| 7 | Aspenter 75 mg, 28 comprimate, Terapia | 1,868 |
| 8 | MK Gerovital Kids Crema hidratantă față&corp 5 ml | 1,707 |
| 9 | Lapte praf Bio Kinder Organic de la 12 luni, 500g, Topfer | 1,466 |
| 10 | Magneziu bisglicinat Premium, 60 capsule, Boost4Life | 1,342 |
Fashion
The Fashion category continues to be an important growth engine. This dynamic confirms both the recovery of consumption in the fashion segment after the Q4 peak period and the category's ability to scale efficiently through affiliation. At the same time, the amplitude of growth differences suggests that commercial execution and campaign optimization play an essential role in capturing demand, particularly evident for the category leader this quarter, which is defined by massive investments and optimizations over the past year, across the entire business chain.
| # | Product | Number of Sales |
|---|---|---|
| 1 | Broșă lalea albă cu codiță metalică aurie | 456 |
| 2 | Adidași bărbați casual negri | 248 |
| 3 | Broșă lalea albă cu codiță metalică verde | 238 |
| 4 | Soluție pentru impermeabilizat Grăsime de focă Reflex - 100ml | 83 |
| 5 | Spray pentru lărgit, Solitaire | 73 |
| 6 | Ghete damă Genio Negre | 51 |
| 7 | Adidași bărbați casual VIP albi | 49 |
| 8 | Sneakers damă Puss Negri | 48 |
| 9 | Pantofi Casual Trevy Negri | 46 |
| 10 | Pantofi damă Butyn Negri | 43 |
Health & Personal Care
In Health & Personal Care, the data indicates high volatility and accelerated market share redistribution. On one hand, the category leader, aronia-charlottenburg.ro, records strong growth thanks to its undisputed commercial offer, investments across all business areas, and a strong embrace of affiliation. On the other hand, e-shops that decided to shut down certain volume-generating traffic sources are experiencing declines. These variations suggest a category in transformation, where consumer preferences and product positioning rapidly influence performance, and competitive advantage can shift in a relatively short time.
| # | Product | Number of Sales |
|---|---|---|
| 1 | Pungă gheață instant, 13x15cm, 105g, PRIMA, uz extern | 6,733 |
| 2 | Câmp operator steril, PRIMA, 38x45cm | 3,928 |
| 3 | Carnet de sănătate pentru câini și pisici PRIMA, albastru | 3,428 |
| 4 | Colesterol Formula – 60 capsule | 2,222 |
| 5 | Premium Aronia Colagen Joints & Muscles | 2,152 |
| 6 | Teste Bowie&Dick PRIMA pentru testare autoclav | 2,126 |
| 7 | Câmp operator steril, PRIMA, 45x75cm | 2,069 |
| 8 | Canulă nazală oxigen pentru adulți 2.5m, PRIMA, sterilă | 2,038 |
| 9 | Premium D3+K2+Magnesium | 1,965 |
| 10 | Omega 3 – 1000mg, 450 EPA – 230 DHA, 90 capsule | 1,956 |
Beauty
The Beauty category presents a similar polarization pattern, with large differences between merchant performance, indicating intense competition and a possible shift in consumer behavior or in the promoted product mix. This dynamic reflects a market sensitive to trends and to how brands adapt their offerings and promotional strategies.
| # | Product | Number of Sales |
|---|---|---|
| 1 | Celebrity Secret Beauty Bag | 7,044 |
| 2 | Pilă semilună Staleks | 1,324 |
| 3 | Vecchia Romagna Brandy Etichetta Nera 1000 ml | 930 |
| 4 | Aperol Lichior Aperitivo 1000 ml | 891 |
| 5 | Rituals The Ritual Of Sakura Body Care Set 245 ml | 782 |
| 6 | Bețișoare Portocal pentru Cuticule SensoPRO Milano – Set 12 bucăți | 495 |
| 7 | Campari Lichior Bitter 1000 ml | 385 |
| 8 | Set Cadou Femei Gerovital H3 Evolution Perfect Look | 362 |
| 9 | Fiolă cu Colagen 2 ml | 337 |
| 10 | Acid Free Bond Primer 2M – 13ml | 336 |
The YoY evolution at the category level shows that the BusinessLeague ecosystem continues to grow through differentiated performance, where category leaders consolidate their position and generate most of the growth. At the same time, categories with high volatility indicate opportunities for rapid market share gains, but also increased risks for players who do not adapt quickly enough to market changes.
Traffic Source Distribution
The BusinessLeague ecosystem continues to show a strong concentration around Google Shopping Ads (CSS), which generates 65.1% of total sales (366,877) and over €17.7 million in value, with the traffic being NON-brand. This channel remains the main ecosystem driver, confirming the efficiency of formats based on direct purchase intent and the ability of affiliates to scale large volumes through constant optimization.
| Surse de Trafic | Number of Sales | Sales Value |
|---|---|---|
| Google Shopping Ads (CSS) | 366,877 | €17,729,536 |
| Google Ads – search | 54,531 | €3,298,647 |
| Cashbacks | 52,150 | €2,598,005 |
| Altele | 89,914 | €6,043,410 |
*Trafic non-brand
Google Ads – search contributes approximately 9.7% of sales (54,531) and €3.29 million, playing an important complementary role, especially in capturing existing demand, overtaking Cashback & Coupons compared to Q4 2025. Although the share is significantly smaller than CSS, the Google Ads Search channel remains relevant through traffic quality and the conversions generated on specific queries. The cashback segment generates 9.3% of sales (52,150) and €2.59 million, confirming its role in the final conversion zone, where users are already close to the purchase decision and are influenced by direct financial benefits.
The "Others" category, with a 16% share of sales (89,914) and over €6 million in value, indicates a healthy degree of traffic source diversification, including content, retargeting solutions, social media, or other emerging channels. This component becomes relevant in the context of reducing dependence on a single dominant channel and exploring new growth opportunities.
The traffic source structure shows a mature ecosystem in which performance channels (especially Google Shopping) generate most of the volume, while other sources contribute to conversion funnel optimization and risk diversification.
Number of Sales - Q1 2026
The distribution is calculated for all 563,472 sales generated through the BusinessLeague platform between January 1 – March 31, 2026.
The First Technology Company Listed on BVB
We are the first technology company listed on the Bucharest Stock Exchange — a business built with the clear vision that marketing can become one of the first industries to be 100% collaborative, transparent, and exclusively results-driven.
The platform we develop connects online stores with marketing specialists through a simple and fair model: advertising at Cost Per Sale. Through our technology, hundreds of online stores collaborate with thousands of marketing specialists in an intuitive way, because we have automated all processes related to legal, commercial, attribution, invoicing, and collection. In practice, we eliminate bureaucracy from marketing and provide a unique collaboration system between marketing entrepreneurs and e-commerce entrepreneurs.
In 2024, we transformed affiliation into a competition — BusinessLeague.com — an e-commerce championship where performance is measured in real sales, not impressions or likes. It is a gamified ecosystem where online stores and affiliates compete, grow, and develop together.
By the end of Q1 2026, we facilitated over 16.5 million sales worth 832 million euros, for thousands of brands in Romania, Bulgaria, and an increasing number of European markets.
We are part of the New Economy. We believe in innovation, transparency, and a meritocratic model where any talented entrepreneur or marketer can win — regardless of where they start.
Business Model
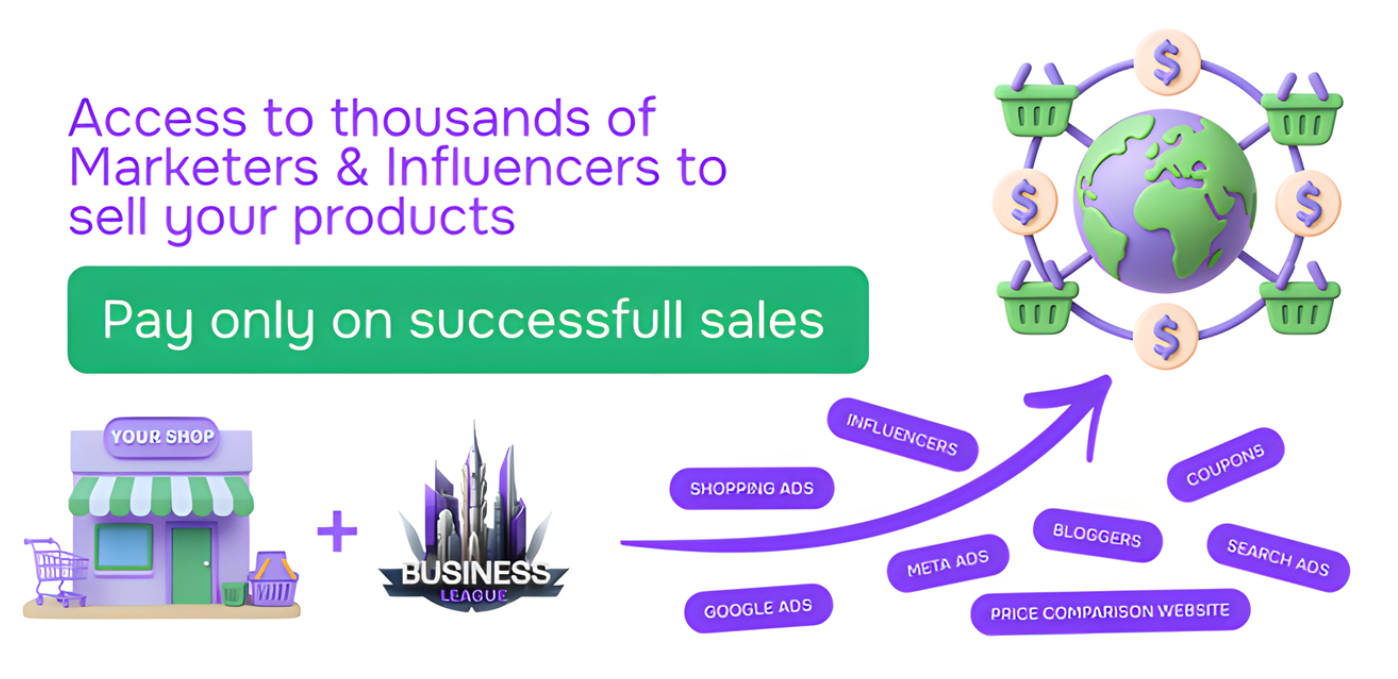
2Performant is a marketplace that brings together e-commerce entrepreneurs with digital marketing professionals, in a model based solely on cost per sale. Advertisers — online stores — pay only when they sell. Marketers — affiliates — are rewarded based on the performance they generate. The platform is self-service, gamified, and oriented toward maximum efficiency.
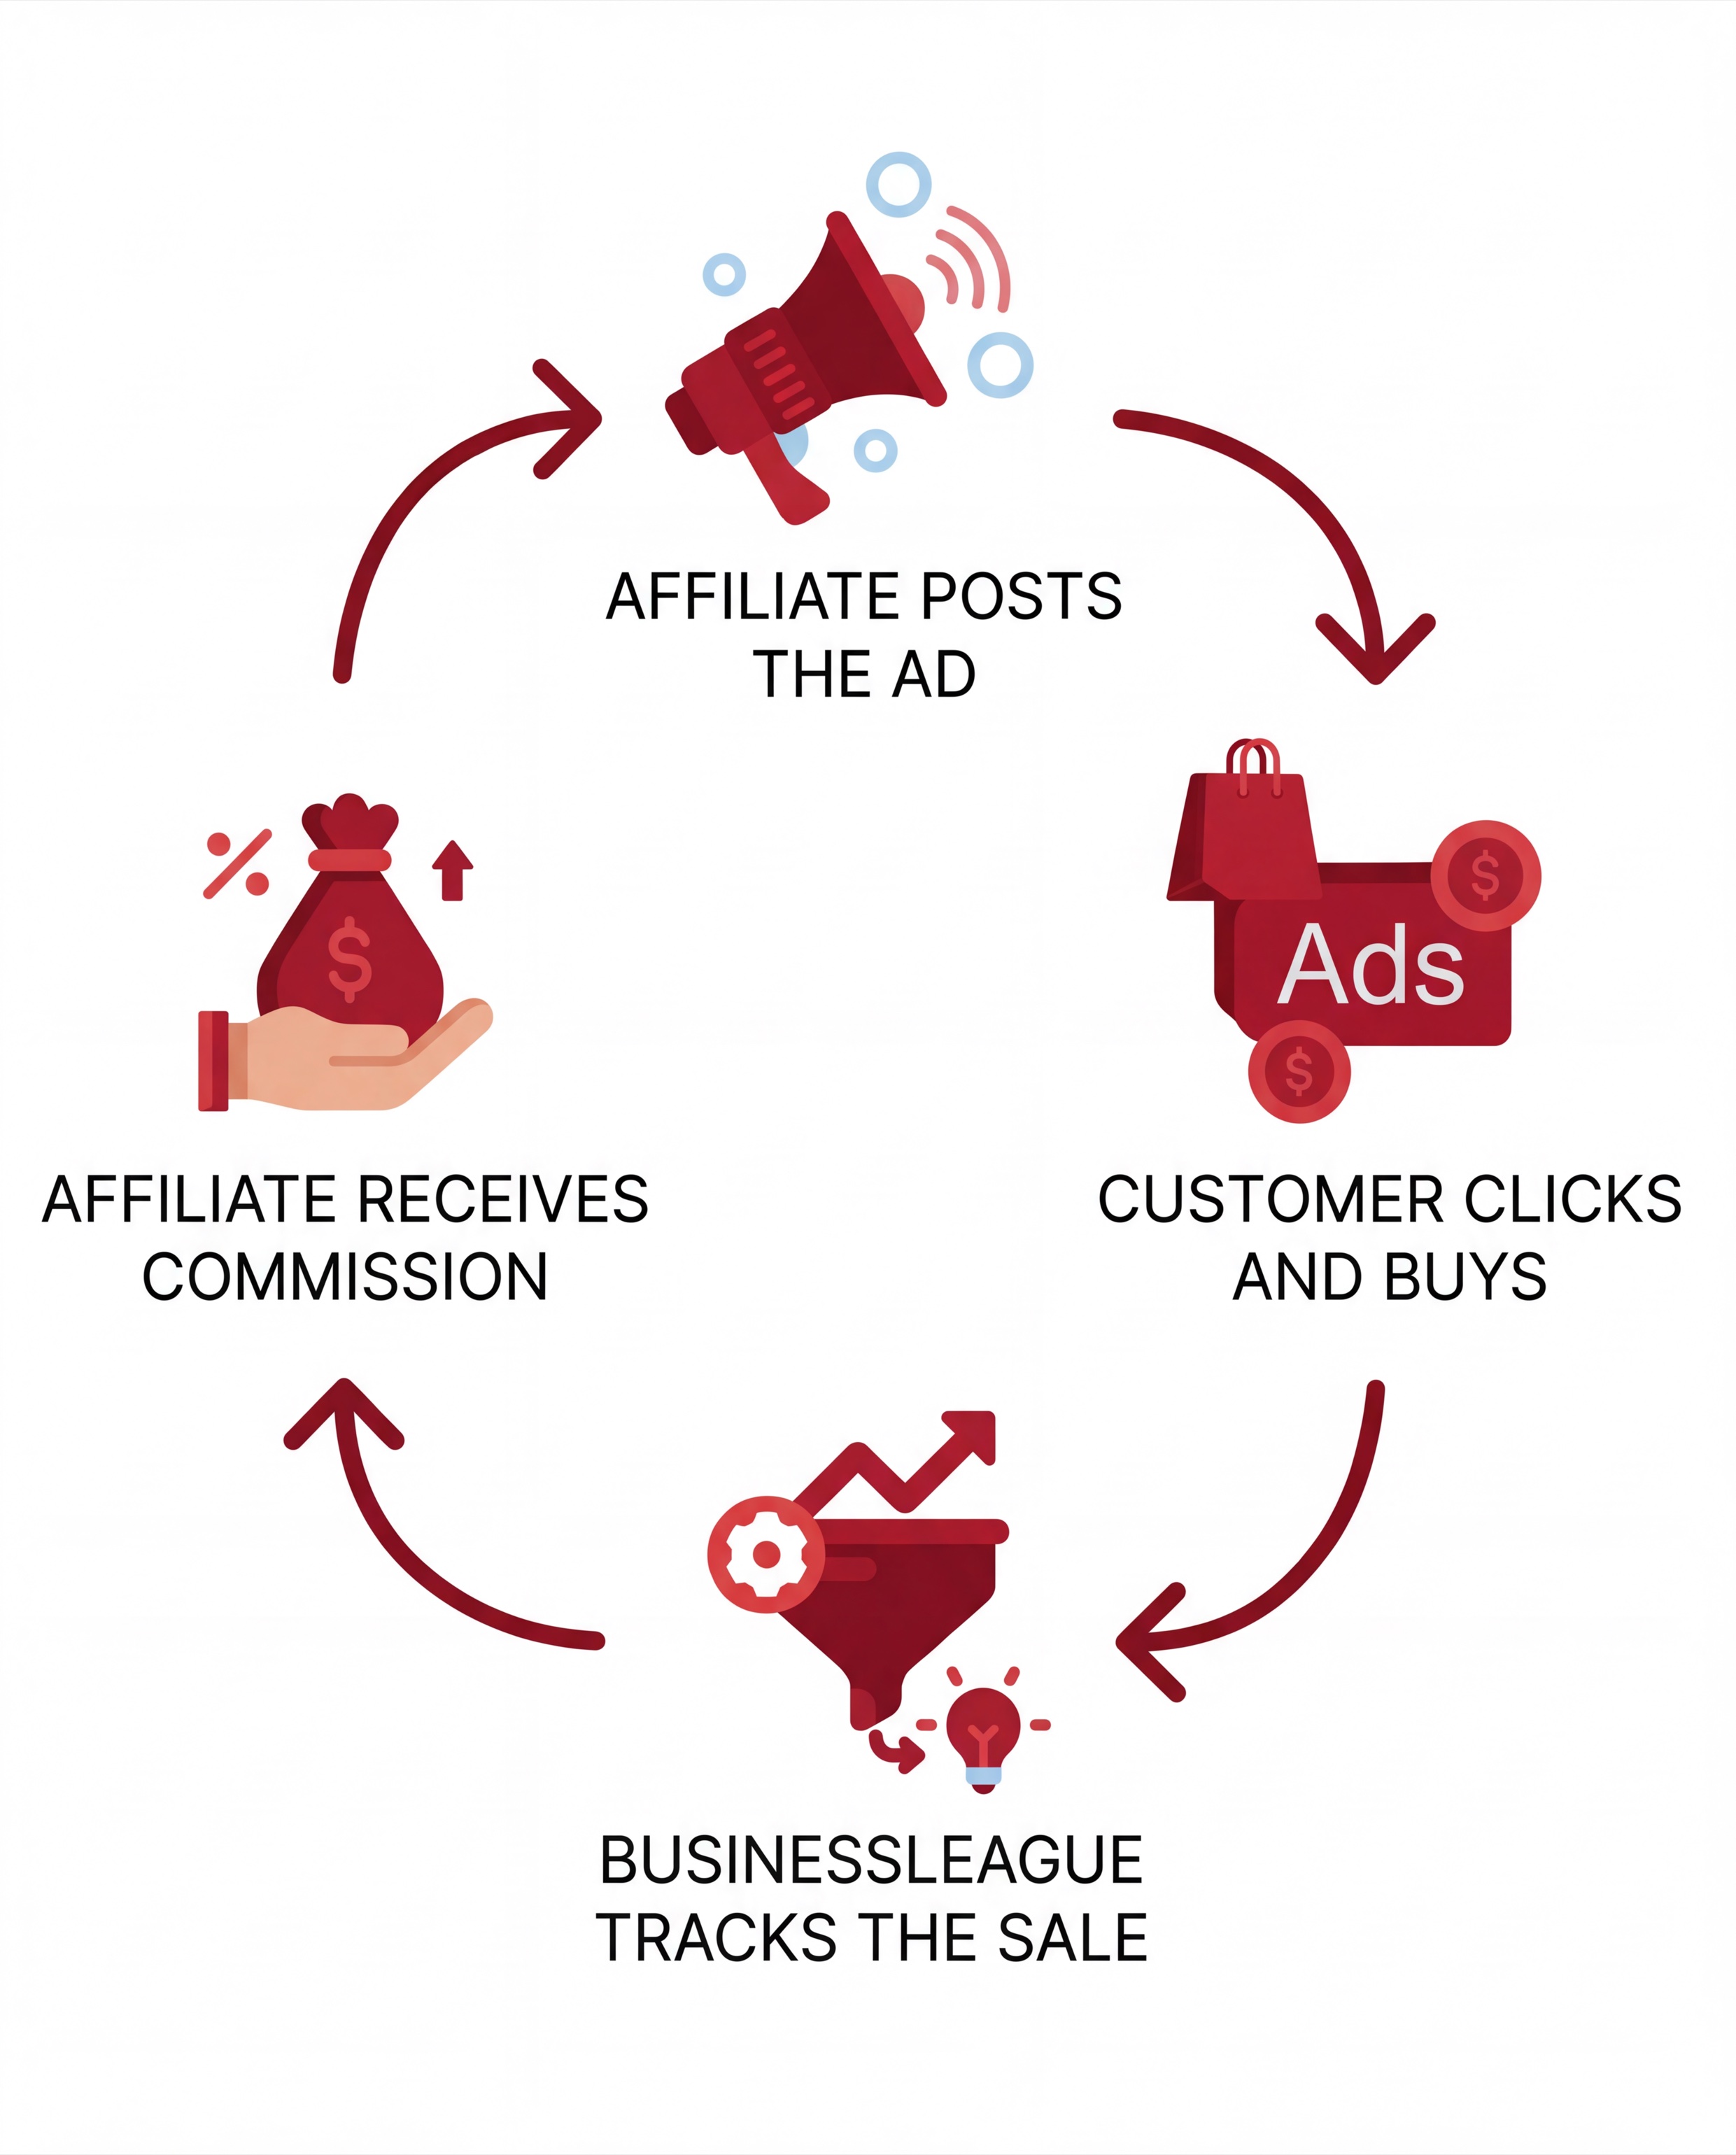
Affiliate Marketing
Affiliate marketing involves promotion paid at cost per sale. For brands, affiliate marketing is probably the most efficient promotion and sales tool, and for specialists, it is the simplest way to earn revenue using their time and digital marketing skills.
The BusinessLeague platform mediates this relationship, making it simple, fair, and performance-based.
Advertisers / Merchants
Online stores that use the 2Performant platform to promote their offers through affiliation. They increase their sales exclusively based on the performance generated by affiliates.
Affiliates / Marketers
Affiliates are platform users who promote advertisers' offers online through affiliate relationships. They generate targeted traffic for online stores and are compensated based on performance.
The traffic sources they use are diverse: Google Ads, Meta Ads, TikTok, YouTube, blogs, cashback, price comparators, influencers, and more.
Revenue Model
Within its affiliate marketing activity, 2Performant generates revenue from two main sources:
The business model and the BusinessLeague competition allow both affiliates and advertisers to receive rewards based on their success in the categories they participate in.
Additionally, the platform generates indirect revenue through commissions paid by advertisers to affiliates, amounts that transit through 2Performant and contribute to the total operated turnover, thus supporting ecosystem development and consolidating the company's market position.

The 2Performant platform allows two payment methods for companies: Prepaid — advance payment system and continuous account funding; Postpaid — payment system with weekly or monthly billing. For the Prepaid payment method, 2Performant has implemented the Direct-Debit functionality, which automates the affiliate program funding process, ensuring an uninterrupted flow of sales.
2Performant Network SA • SMT AeRO Premium • Symbol: 2P
Bucharest Stock Exchange • Operational Report Q1 2026